The primary goal of the initial design of Tstat was to automate the gathering of TCP statistics for traffic aggregation by utilizing real-time monitoring capabilities. However, as time progressed, Tstat underwent significant development and transformation into a more sophisticated tool, providing extensive statistics and functionalities. It was developed in ANSI C, prioritizing efficiency, and has now become an Open Source tool. Tstat enables advanced analysis of multi-Gigabit per second traffic in real-time using commonly available hardware. Notably, the design of Tstat is remarkably adaptable, featuring various plug-in modules that offer diverse capabilities.
AWK is a scripting language used for text processing and data manipulation. It operates on structured data, typically in files, by applying rules to patterns. An AWK script consists of rules that specify patterns and actions. It reads input line by line, matches patterns, and performs associated actions. AWK has built-in features like pattern matching, string manipulation, arithmetic operations, variables, arrays, and control structures. It supports regular expressions and provides useful variables like $0 (entire line) and $1, $2 (fields/columns). AWK is widely used for tasks like data extraction, formatting, reporting, and analysis due to its simplicity and efficiency in handling large datasets.
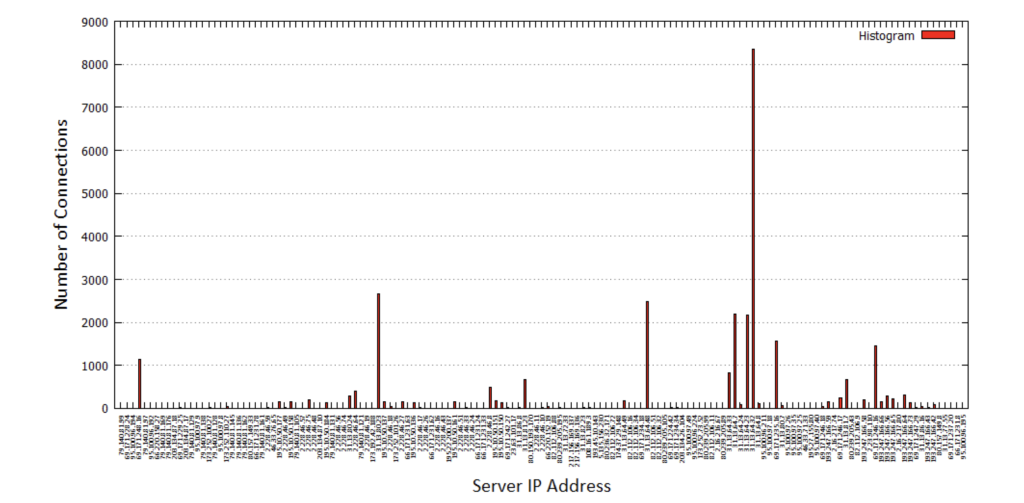
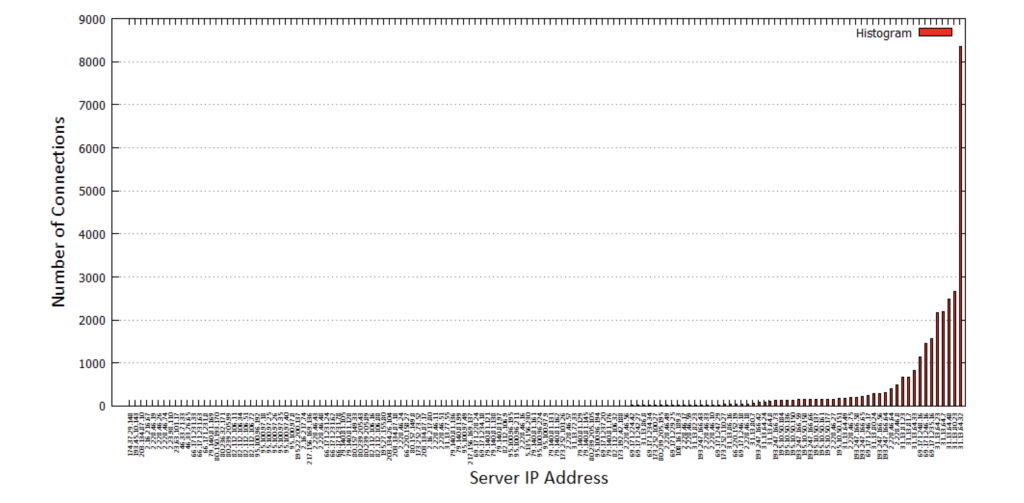
1.1. Produce a histogram that counts, for each server IP address, the number of connections whose client is “local”, uses HTTP as L-7 protocol and are directed to “*.facebook.com”
The output of using this script is shown:
{if(NR!=1){if ($99==1&&$101==1&&$115~/facebook.com/) {#histogram of server IP Address hist[$45]++ #FQDN fqdn[$45]=$115 ##total count count++} }} END { {print “Server_IP_Address” ,”Number_of_Connections”, “Fraction”,”Percentage”, “FQDN” } for (x in hist) {print x, hist[x], hist[x]/count, hist[x]/count*100, fqdn[x]} }
So the most used service has the FQDN: “-“, which means unknown, this can include protocols other than HTTP. Other most used services include Facebook, Facebook CDN Akamai, Google, Zynga Farmville, and “ib.adnxs.com” which looks like some ad service.
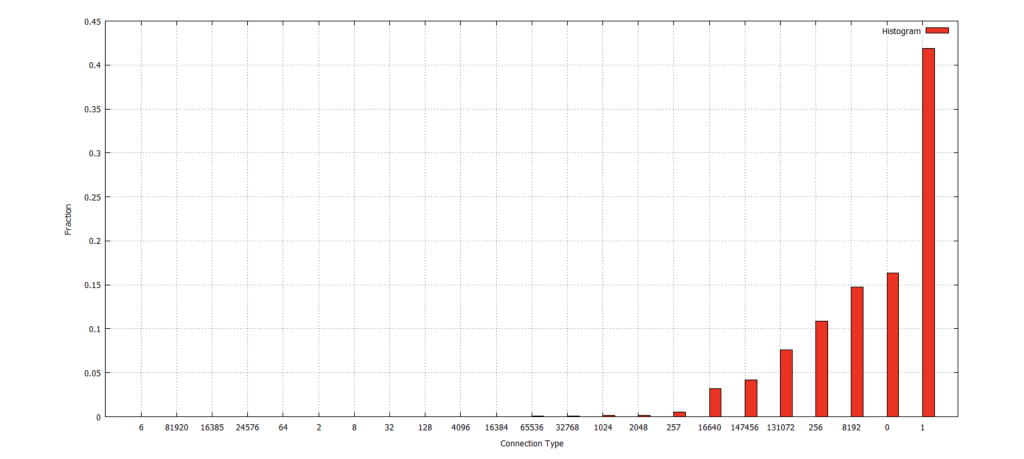
1.3. Write a script that counts the fraction of connections for “connection type” and then plot the results over time.
The awk script used here is:
{if(NR!=1){conntype[$101]++ count++}} END { { for (x in conntype) {print x, conntype[x], conntype[x]/count} } }
Then the file of results is used to plot the histogram:
Figure 1.3-1 Histogram of Fraction vs. Connection Type
1.4. Write a script that counts the fraction of HTTP flows every 10,000 connections. Plot the results over time. Add a second line to the above plot that reports the fraction of BitTorrent connections over time. Add a third line with the number of eMule flows over time.
The awk script used here is:
{ if(NR!=1) { if($101==1){count++} if($101==131072||($101==256&&$102==9)){count1++} if($101==16384||($101==256&&($102==1||$102==3))){count2++} if((NR-1)%10000==0) { http[NR-1]=count-lastcount; bittorrent[NR-1]=count1-lastcount1; } } emule[NR-1]=count2-lastcount2; lastcount=count lastcount1=count1 lastcount2=count2 } END{ http[NR-1]=count-lastcount; bittorrent[NR-1]=count1-lastcount1; emule[NR-1]=count2-lastcount2; print “Time” , “HTTP_Fraction” , “Bittorrent_Fraction” , “eMule_Fraction” for (t in http) {print t/10000,http[t]/10000,bittorrent[t]/10000,emule[t]/10000} } #t is the time
Decompresses the file, reads only the first 1000000 lines and gives it as an input to the AWK Script. The AWK Script then returns some result which is sorted according to the second column of the output
Checks if the current flow has an internal client and the FQDN contains the keywords “youtube” and “cache”
tot_int[$45]++;
Increment a counter for each server IP, i.e. count number of connections to each server IP
alreadyIn = match (name[$45],$115);
This command checks for a string match between name[$45] and FQDN. In first iteration, the name[$45] is empty, therefore no match. After the first iteration, this command may give a match. If no match, the result is zero.
if(alreadyIn==0)
name[$45]=name[$45] "," $115
}
}
If the match command returns zero value, this command adds the FQDN to the entry “name[$45]” for the server IP.
END {
print "number\tIP address\tnames";
for (addr in tot_int) {
print tot_int[addr] "\t" addr "\t" name[addr]}}
At the END, print the total number of connections to that server IP having source internal client and FQDN containing, “youtube” and “cache”, print the server IP and also the FQDN.